

NIH has long collected self-designated demographic information on scientists designated as Principal Investigators (PIs) or Key Personnel and used this information to gain insights into the NIH-supported biomedical research workforce. Just over 10 years ago, Ginther and colleagues used these data to publish a seminal paper that showed that Black/African American PIs were less likely than whites to receive funding on R01 applications. Since that publication, NIH embarked on efforts to enhance diversity of the biomedical research workforce; these efforts include establishing the Chief Officer for Scientific Workforce Diversity, the Diversity Program Consortium as well as numerous other trainee-focused interventions to enhance scientific workforce diversity.
NIH tracks the success of applicant PIs (that is scientists designated by their institutions as PIs on applications for funding) with a metric called the “funding rate,” which is the ratio of the number of unique applicant PIs who are successful on at least one application to the number of unique applicant PIs who submitted at least one application. Thus, if in a given fiscal year there were 40,000 unique PIs and 10,000 who were successful in securing funding at least once the funding rate would be 10,000 / 40,000 or 25%. Figure 1 shows funding rates for PIs who sought funding on NIH Research Project Grant applications.
Figure 1: Funding rates for Research Project Grant (RPG) Principal Investigators (PIs) 1998-2021.
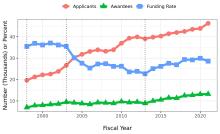
Figure 1: Applicants are unique scientists designated by their institutions as PIs on at least one RPG application. Awardees are unique scientists designated by their institutions as PIs on at least one funded RPG application. The funding rate is the ratio of unique awardees to unique applicants.
Now we focus on data derived from the voluntary collection of personal demographic information. Table 1 shows selected characteristics of FY2021 applicant PIs according to race-ethnicity. It is important to note that nearly 12% chose not to provide their race-ethnicity. There were differences: for example, self-designated Black/African American PI, who constituted 2.6% of applicants, were less likely than whites to submit an application proposing animal research, but more likely to submit an application proposing human participant research.
Table 1: RPG PI Characteristics FY2021. Characteristics of scientists designated as Principal Investigators (PIs) on at least one Research Project Grant (RPG) application submitted to NIH in FY2021 according to self-designated race-ethnicity.
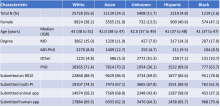
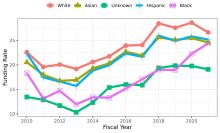
Figure 2 shows the number of unique RPG applicant PIs from FY2010 to FY2021 according to self-designated race-ethnicity. The absolute numbers of Black/African American and Hispanic applicants remained low, consistent with NSF data of underrepresented groups. Nonetheless, as shown in Figures 3 and 4 show, the numbers of Black/African American and Hispanic applicants have recently increased substantially – in relative terms. Figure 5 shows the funding rates for Type 1 RPG applicants; race-ethnicity differences appear to be narrowing over the last 2 years. Figure 6 shows corresponding data for Type 1 R01-equivalent applicants.
Figure 2: Number of unique RPG applicants (scientists designated as PIs by their institutions on RPG applications submitted to NIH) FY2010-FY2021 according to self-designated race-ethnicity.
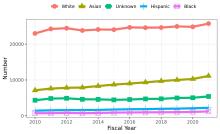
Figure 3: Number of unique self-designated Black RPG applicants (scientists designated as PIs by their institutions on RPG applications submitted to NIH) FY2010-FY2021.
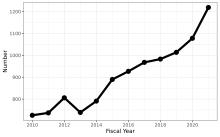
Figure 4: Number of unique self-designated Hispanic RPG applicants (scientists designated as PIs by their institutions on RPG applications submitted to NIH) FY2010-FY2021.
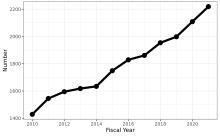
Figure 5: Funding rates for Type 1 Research Project Grant (RPG) Principal Investigators (PIs) 2010-2021 according to self-designated race-ethnicity.
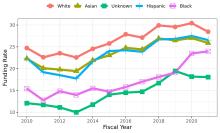
Figure 6: Funding rates for Type 1 R01 Principal Investigators (PIs) 2010-2021 according to self-designated race-ethnicity.
We have more data to show which we are posting here. We hope you will take a look at these data, as well as other NIH postings on workforce diversity.
Although the trend towards reduction of the NIH funding gap is gratifying, significant work remains before the NIH realizes a truly diverse scientific workforce representative of our nation. As such, the NIH has renewed its commitment to enhancing diversity, equity, and inclusion, particularly through UNITE. The NIH will continue developing new interventions and enhancing existing programs to promote inclusive excellence, building upon demonstrated success.
We are grateful to our colleagues in the NIH Division of Biomedical Research Workforce, the NIH Division of Statistical Analysis and Reporting, and the NIH Chief Officer for Scientific Workforce Diversity office for helping us prepare this blog.